This site uses cookies to improve your experience. To help us insure we adhere to various privacy regulations, please select your country/region of residence. If you do not select a country, we will assume you are from the United States. Select your Cookie Settings or view our Privacy Policy and Terms of Use.
Cookie Settings
Cookies and similar technologies are used on this website for proper function of the website, for tracking performance analytics and for marketing purposes. We and some of our third-party providers may use cookie data for various purposes. Please review the cookie settings below and choose your preference.
Used for the proper function of the website
Used for monitoring website traffic and interactions
Cookie Settings
Cookies and similar technologies are used on this website for proper function of the website, for tracking performance analytics and for marketing purposes. We and some of our third-party providers may use cookie data for various purposes. Please review the cookie settings below and choose your preference.
Strictly Necessary: Used for the proper function of the website
Performance/Analytics: Used for monitoring website traffic and interactions
NetPromoterScore (NPS) is one of the most popular metrics being used in business today. And while NPS has many supporters to sing its praises, there seems to be an equal number of critics who have emerged to decry it, citing a number of reasons why it should be abolished. Myth #1: NPS is not predictive.
The Imperative for Diverse Metrics and Measurements in Understanding Customer Sentiment Introduction NetPromoterScore (NPS) has established itself as a popular metric for evaluating customer loyalty, satisfaction levels, and the likelihood of customer churn. Should you kill NPS?
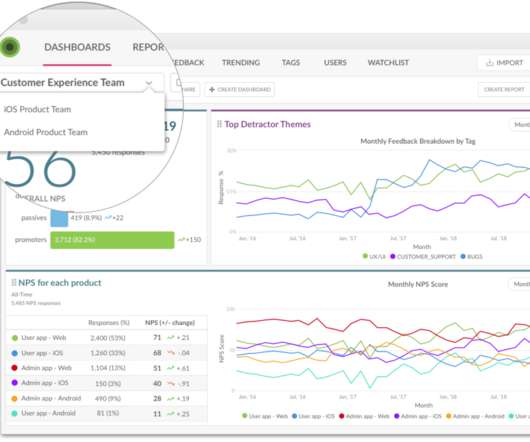
Many smart companies use NetPromoterScore (NPS) to measure how well they’re meeting the needs and expectations of their customers. Enterprise messaging software company Slack, for instance, treats NPS as a leading indicator of growth, using it to improve its interactions with customers and prospects.
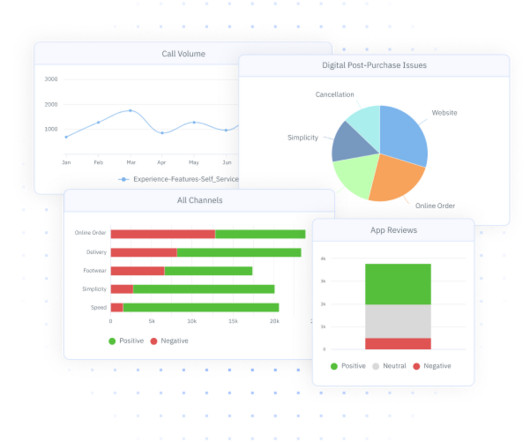
Key Metrics To Track for Voice of Customer Analysis NetPromoterScore Customer Satisfaction Score (CSAT) Customer EffortScore (CES) Response Rate Customer Lifetime Value (CLV) Churn Rate VoC metrics provide valuable insight into customer satisfaction and loyalty.
For years, metrics such as the limited NetPromoterScore (NPS) and customer satisfaction (CSAT) surveys have been the backbone of CX perceived measurements along some other metrics and data. However, organizations across high-tech, telecom, utilities, and finance sectors are finding these methods increasingly limited.
Most companies focus on continuously improving their customer satisfaction, and tracking NetPromoterScore is an important step in building a culture of Customer Success. Over the years, NetPromoterScore has proven to be a key customer satisfaction metric. This volatility can lead to several issues.
NPS, CES, and CSAT are customer loyalty metrics. Today, we’ll discuss the three most popular customer loyalty metrics that fall under the structured category—NPS, CES, and CSAT—and the role that each should play in your CX strategy. An introduction to NPS, CES, and CSAT . NetPromoterScore (NPS).
Together, these can give you insight into where you stand and how to improve your CX: NetPromoterScore ( NPS ) Customer Satisfaction (CSAT) Customer EffortScore ( CES ). What Is NetPromoterScore (NPS)? Customers who are promotersscore 9 or 10.
91% of companies surveyed stated that NPS or another alternative CSAT KPI was a key field service performance metric for their organization. As a central part of CX metrics, Customer EffortScore (CES) is emerging as a core KPI in field services. Why Customer EffortScore Is an Important Field Service Performance Metric.
Agent EffortScore (AES) AES is a unique metric that provides insight into agent performance from their perspective. NetPromoterScore (NPS) If a customer is loyal to your brand, they have likely had a positive experience with your call center, too. It is usually calculated on a 5- or 7-point scale.
NetPromoterScore (NPS®). NetPromoterScore® (NPS) is a trademarked metric between -100 and 100 that captures in aggregate the propensity of a company’s customers to attract and refer new business or/and repeat business. Customer EffortScore (CES).
How it complements CS : CSAT helps determine whether CS efforts, such as onboarding and training, are effective. Customer EffortScore (CES) Measures the effort required to resolve an issue or complete a task. NetPromoterScore (NPS) Measures customer loyalty by asking how likely customers are to recommend the product.
For instance, it’s common to send out NetPromoterScore ( NPS), Customer Satisfaction (CSAT/OSAT), or Customer EffortScore ( CES ) surveys after a customer interacts with a brand, but what do these scores actually tell us?
Customer Satisfaction Score (CSAT) surveys have emerged as the gold standard for measuring how customers perceive their interactions with a brand. However, there are many different survey methods to choose from to measure a customer’s experience — including Customer EffortScore (CES) , NetPromoterScore (NPS) , and many more.
Below, we’ll take a look at the three most common key performance indicators (KPIs) used to measure different aspects of the customer experience: Customer Satisfaction, NetPromoterScore and Customer EffortScore. NetPromoterScore (NPS). Customer EffortScore (CES).
Thats where Customer EffortScore (CES) steps in to save the day. Reducing effort directly boosts satisfaction, loyalty, and repeat business. While metrics like CSAT or NPS focus on the big picture such as overall happiness or loyalty CES zooms in on the little moments that can make or break a customers experience.
Its relationship NPS (a metric that focuses on long-term relationships between customers and businesses) doubled year-on-year. A high NPSscore indicates strong customer satisfaction and brand advocacy. Customer Satisfaction Score (CSAT) : CSAT measures how satisfied customers are with specific interactions or experiences.
And it’s the level of customer effort —how quickly and effectively issues are solved—that will determine how likely they will return to your company. To see where your company stands with this, use a customer effortscore (CES) survey that asks the user to rate a statement on a scale of 1-10.
This involves setting up multiple feedback channels such as customer surveys, social media listening, direct customer interviews, and netpromoterscores (NPS) to capture ongoing customer sentiment and insights. Regularly updating the strategy based on customer feedback and evolving market conditions is crucial.
3 Metrics CX Teams Use to Measure Customer Feedback There are a lot of customer experience metrics teams can track, but we see three most commonly used: Netpromoterscore (NPS), customer satisfaction score (CSAT), and customer effortscore (CES). NetPromoterScore What is it?
These can include: NetPromoterScore (NPS) Customer Satisfaction (CSAT) Customer EffortScore (CES) These metrics can reflect the changes in how the customers perceive their experience.
Classic CX surveys like NPS , PSAT, CSAT , and Customer EffortScore(CES) monitor customer sentiment—providing critical insight into behavioral and revenue metrics. NetPromoterScore (NPS): Loyalty and More. NPS Surveys ask two questions…. Why is NPS key to Product Led Growth?
Here are ten key metrics to help you see if your CX initiatives are delivering the expected returns: Customer EffortScore (CES): Measures how easy it is for customers to perform tasks like purchasing a policy, filing a claim, or resolving any inquiries.
Measuring CX requires a layered approach that can include in-depth user interviews and gathering data at key points of contact, as well as tracking customer experience metrics like NPS, CSAT, and CES, among others. To calculate your NetPromoterScore, simply subtract the percentage of Detractors from the percentage of Promoters.
If you want to confidently predict which customers will be referrers and which will repurchase, look no farther than NPS, or NetPromoterScore. NPS surveys ask, How likely are you to recommend us? You can use NPS to segment customers into three groups: Promoters, Passives, and Detractors.
So you’ve been reading up on NetPromoterScore. It’s true that NetPromoterScore is a great way to engage with your customers and solicit tons of feedback. As a SaaS company with SaaS customers like Zoom, DocuSign and Hubspot, we have a unique perspective on NPS in cloud software. Have questions?
While these emotions are abstract, metrics like the Customer Satisfaction Score (CSAT ) or NetPromoterScore (NPS) can quantify them, giving businesses a clearer picture of their customers’ sentiments. For a more comprehensive understanding of CSAT scores and how they can be effectively utilized, click here.
These more defined metrics can present as any of the four types of CSAT surveys: #1: Customer Satisfaction Score (CSAT). #2: 2: NetPromoterScore (NPS®). #3: 3: Customer EffortScore (CES). #4: We use InMoment for both our employer and end-user NetPromoterScore program.
The Customer EffortScore (CES) asks, “How easy did [organization] make it for you to handle your issue?” Measure customer loyalty with NPS. The NetPromoterScore ® (NPS ® ) asks, “How likely are you to recommend us to others?”
Identify Your Detractors with NetPromoterScore ® (NPS ® ). NPS surveys determine customer loyalty by asking on a scale of 1-10, “ How likely are you to recommend us?” ” The term Detractors refers to those customers who give your business a score of 6 or below.
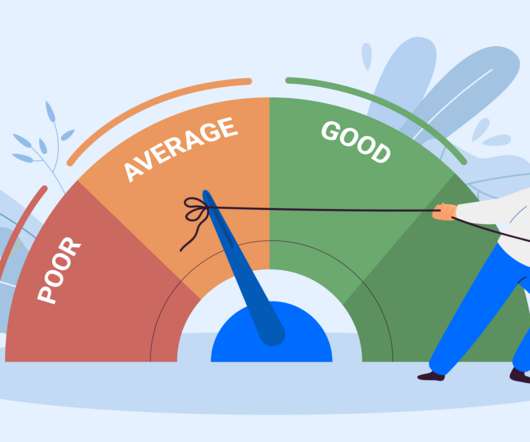
High NPSscores can definitely feel like a big win. After all, NetPromoterScore is a popular way to gauge how happy your customers are and how likely they are to recommend your business to others. But here’s the catch: a high NPS doesn’t always mean everything is going perfectly. So why does this matter?
The customer effortscore (CES) is a key metric that shows companies how simple or difficult it is for customers to do business with them. It measures how much effort a customer has to put in to use a product or service, acquire information about its usage, or address a problem. NetPromoterScore (NPS).
NetPromoterScore (NPS) was the “only” metric that mattered for a while. But now there is a backlash in some organizations and data like Customer EffortScores (CES) are on the rise. But those dashboards loaded down with chart after chart? What metric will matter tomorrow?
For example, our support team measures Customer EffortScore (CES) across support channels and case categories. They use a dashboard to compare customer effort by support channel and topic, so they can spot customer painpoints and alert the right team. Learn how to push GetFeedback survey responses to Slack.
To measure customer happiness, turn to CSAT, CES, and NPS. Customer Satisfaction (CSAT) Score. As customers reply, you can keep track of your average score and segment responses by specific criteria (like customer type, region, agent, etc.) Customer EffortScore (CES). NetPromoterScore (NPS).
Together, these can give you insight into where you stand and how to improve your CX: NetPromoterScore ( NPS ). Customer EffortScore ( CES ). What is NetPromoterScore (NPS)? Customers who are promotersscore 9 or 10. Passives score 7 or 8.
If you don’t consider customer effort as a truly important part of the journey, then you’re not thinking of your customers. In some cases, Customer EffortScore (CES) is a better indicator of loyalty than NetPromoterScore (NPS).
These include: Customer Satisfaction Score (CSAT) NetPromoterScore (NPS) First Call Resolution (FCR) Customer EffortScore Each of these metrics measures the quality of customer interactions, putting qualitative and emotional data into measurable formats.
There’s a reason a good NetPromoterScore (NPS) question is more along the lines of, “How likely would you be to recommend us to a family or friend?” For instance, if you want to decrease customer churn , your best options are the Customer EffortScore (CES) survey and the NetPromoterScore (NPS) survey.
According to The State of the Customer Experience survey that we did earlier in 2018, all companies track customer experience using one or several of the 6 world-wide recognised KPIs: NetPromoterScore (NPS), Customer Satisfaction (CSAT), Churn rate, Retention rate, Customer Lifetime Value (CLV) or Customer EffortScore (CES).
Data drives their decisions by monitoring NPS, CSAT, CES, and return trends, they identify pain points and push for actionable improvements. Step 1: Reviewing Key KPIs (CSAT, NPS, CES, and More) CX isnt just about gut feelings its about data-driven decisions. NPS (NetPromoterScore) : Would you recommend us?
Getting Real about CX Metrics When measuring the results of your CX actions, its easy for leaders to get into a cycle of measuring feedback metrics like NetPromoterScore (NPS), customer effortscore, or customer satisfaction (CSAT) rate and reporting on those monthly.
Typically, most brands focus on surveying just a couple of key touchpoints, like post-purchase NPS to measure customer loyalty, or post-helpdesk interaction CSAT to gauge service satisfaction. NPS surveys measure customer loyalty and advocacy by asking the question: “How likely are you to recommend our product/company to a friend?”.
We organize all of the trending information in your field so you don't have to. Join 5,000+ users and stay up to date on the latest articles your peers are reading.
You know about us, now we want to get to know you!
Let's personalize your content
Let's get even more personalized
We recognize your account from another site in our network, please click 'Send Email' below to continue with verifying your account and setting a password.


Let's personalize your content